


Estimating the net cost of the measure

The aim of this chapter is to guide Member States in the estimation of the budgetary effects of PHS measures. Before we present the key elements that have to be taken into account when estimating the budgetary cost of a measure, we must present some key observations on the assessment of net costs as well as the level and financing of public intervention:
- First, it is important to recall that PHS include many types of services. Specifically, PHS include both care and non-care activities. In light of that, the cost of the policy should be assessed according to the type of service that is supported. For example, policymakers may consider that the public net cost of a care supporting policy may be higher than the cost of a non-care supporting policy, owing to its nature. This chapter provides tools to measure the net cost of the policies. It does not provide an assessment of the maximum amount a public authority should spend on any given policy.
- PHS measures lead to a number of earn-back effects that could generate revenue for various types of public administration. Therefore, the net effect for all public administration should be taken into account, not only the net effect for the authority in charge of the measure.
The figure below summarises and simplifies the key aspects to be taken into account when estimating the budgetary cost of a measure.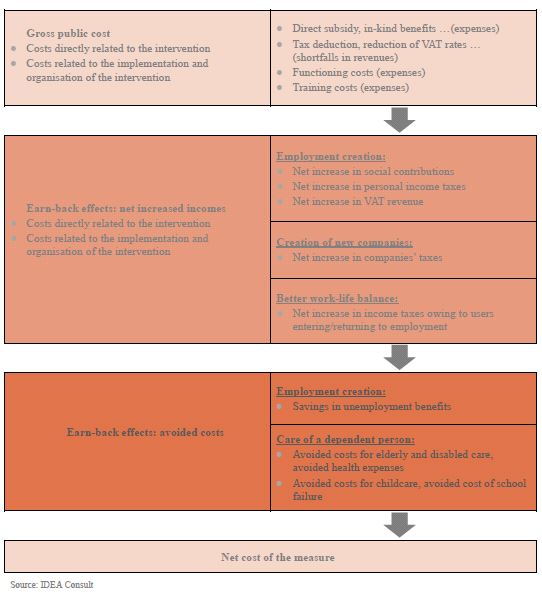
As mentioned in the figure, the net cost of the measure should be measured by calculating the gross public cost of the measure and subtracting the possible earn-back effects. As concerns the earn-back effects, we have to distinguish between the earn-back effects that are the result of increased incomes and the earn-back effects that are related to avoided costs.
|
Box 2. Net cost of PHS measures in Belgium, France and Sweden Belgium: in 2013, the gross public cost of the service voucher system amounted to € 1.93 million. This included government intervention through the voucher, tax deductions for users and the functioning costs of the system. However, the yearly evaluations of the system conducted on behalf of the government have identified many earn-back effects which amount to: – between € 937 and 961.9 million in net increased income, mainly from increases in social contributions and personal income tax, – between € 339.3 and 453.3 million of avoided costs as a result of savings linked to employment creation. Thus, taking into account all these earn-back effects, the net cost of the service voucher system was estimated at € 584 245 134, which represents a cost of € 3.901 per worker. France: according to a study by Wyman, the gross public cost of PHS measures amounted in 2010 to € 6.2 billion. The study reveals that this gross public cost – made up of tax reductions and tax credit, reductions in employer contributions and other social and fiscal costs – is largely offset by € 5 627 million in net increases to income generated (i.e. additional social contributions, VAT revenue, and so on), together with € 3 356 million in avoided costs (i.e. avoided costs for dependent persons or childcare). All in all, the PHS sector leads to benefits for the French government that amount to € 2 640 million, or €5 060 for each full-time job. Sweden: in 2011, the employers’ association Företagarna performed a cost-benefit assessment of the RUT system. It concluded that the earn-back effects were larger than the initial cost of the measure. As such, between 2009 and 2010, the gross public cost was SEK 900 million (€ 96.59 million). However the net increased income amounted to SEK 2 900 million (€ 311.23 million) from increases in companies’ taxes, VAT revenue and social contributions. A more detailed overview of the data from and results of these studies is available here. |